ELK-IIS
For ELK and IIS
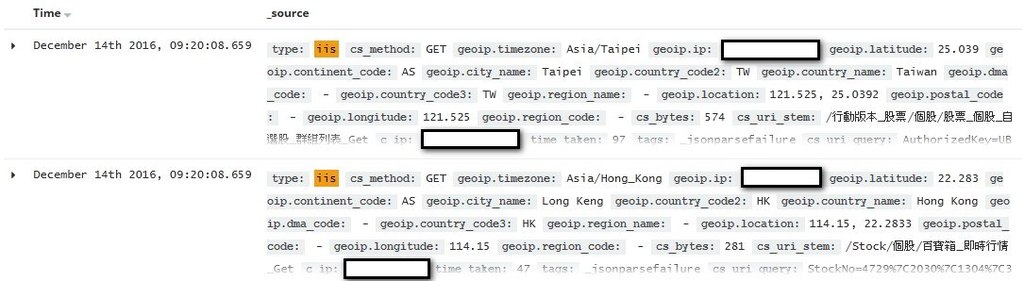
Here is result
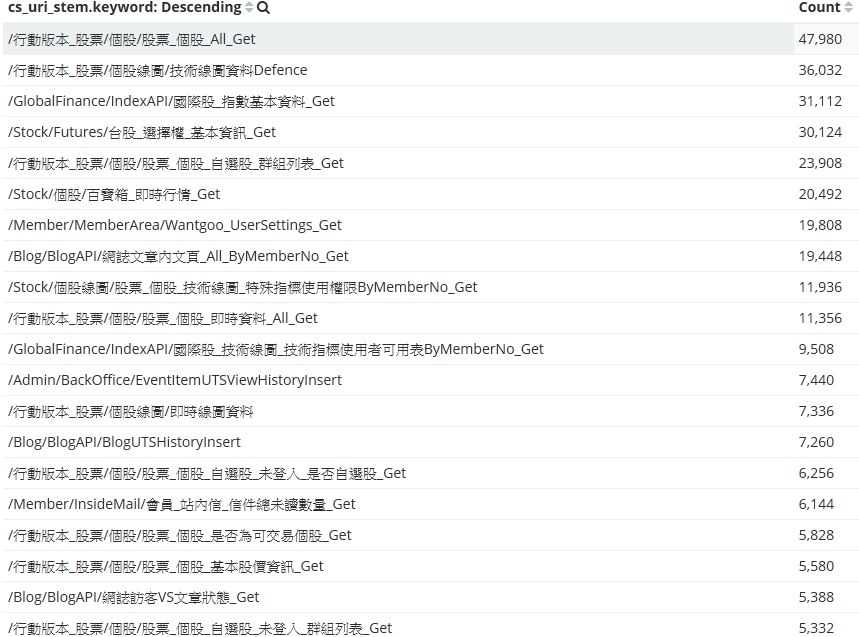
And you can use kibana visualize to count.
This is my IIS log sample.
Especially, you need pay attention to the line 4 (Fields).
#Software: Microsoft Internet Information Services 8.5
#Version: 1.0
#Date: 2016-12-13 20:00:00
#Fields: date time cs-method cs-uri-stem cs-uri-query c-ip sc-bytes cs-bytes time-taken
2016-12-13 20:00:00 GET /js/facebook/FacebookPixelCode.js - 61.228.217.134 716 1008 31
2016-12-13 20:00:00 GET /js/facebook/LinksGetStats.js - 61.228.217.134 550 1004 31
2016-12-13 20:00:00 GET /css/blog/alertify.css versionParams=2016-1212-003 61.228.217.134 4207 1040 31
2016-12-13 20:00:00 GET /css/widget/alertify.css - 112.118.199.37 92 1304 46
2016-12-13 20:00:00 GET /DynamicFiles/DoDataSourceTxt/useDataJs.js v=5951 61.228.217.134 2036 1024 31
2016-12-13 20:00:00 GET /DynamicFiles/DoDataSourceTxt/useDataJs2.js v=5951 61.228.217.134 363 1025 46
Below is my nxlog config for iis
<Input iis_1>
      Module    im_file
      File    "F:\IIS_Log\Default\W3SVC3\u_ex*.log"
    ReadFromLast True
    SavePos True
    Exec    if $raw_event =~ /^#/ drop();
</Input>
And logstash config
input {
    tcp {
        port => 9527
        type => "iis"
    }
}

filter {

        grok {
            match => ["message", "%{TIMESTAMP_ISO8601:iis_time} %{WORD:cs_method} %{URIPATH:cs_uri_stem} %{NOTSPACE:cs_uri_query} %{IPORHOST:c_ip} %{NUMBER:sc_bytes} %{NUMBER:cs_bytes} %{NUMBER:time_taken}"]
             }
        date {
                match => [ "iis_time", "YYYY-MM-dd HH:mm:ss" ]
                target => "iis_time"
                timezone => "Etc/UCT"
             }
        mutate {
                convert => ["sc_bytes", "integer"]
                convert => ["cs_bytes", "integer"]
                convert => ["time_taken", "integer"]
                }
        geoip {
                source => "c_ip"
              }
       }

output {
    elasticsearch {
        hosts => ["localhost:9200"]
    }
}