Implement ELK Stack
- Category: 電腦相關
- Last Updated: Thursday, 12 January 2017 16:37
- Published: Thursday, 10 November 2016 16:59
- Written by sam
Test implement ELK to collect windows event log to identify problems with servers.
Install new OS (Debian 8)
Install Java How to install java 8
Install elasticsearch
wget https://artifacts.elastic.co/downloads/elasticsearch/elasticsearch-5.0.0.deb
dpkg -i elasticsearch-5.0.0.debModify ad uncomment
vi /etc/elasticsearch/elasticsearch.ymlnetwork.host: localhost
/etc/init.d/elasticsearch startInstall Kibana
wget https://artifacts.elastic.co/downloads/kibana/kibana-5.0.0-amd64.deb
dpkg -i kibana-5.0.0-amd64.debUncomment
vi /etc/kibana/kibana.ymlserver.host: "localhost"
/etc/init.d/kibana startInstall Nginx
apt-get -y install nginx
vi /etc/nginx/sites-available/default
server {
listen 80;
server_name elk;
location / {
proxy_pass http://localhost:5601;
proxy_http_version 1.1;
proxy_set_header Upgrade $http_upgrade;
proxy_set_header Connection 'upgrade';
proxy_set_header Host $host;
proxy_cache_bypass $http_upgrade;
}
}
Install Logstash
wget https://artifacts.elastic.co/downloads/logstash/logstash-5.0.0.deb
dpkg -i logstash-5.0.0.deb
Below is my conf in Logstash
vi /etc/logstash/conf.d/sam.conf
input {
  tcp {
    codec => json_lines { charset => "UTF-8" }
    port => 9527
    tags => [ "tcpjson" ]
    type => "nxlog"
  }
}

filter {
  if [type] == "nxlog" {
    json {
      source => "message"
    }

    if [SourceModuleName] == "eventlog" {
      mutate {
        replace => [ "message", "%{Message}" ]
      }
      mutate {
        remove_field => [ "Message" ]
      }
    }

    date {
      locale => "en"
      # timezone => "Etc/GMT"
      timezone => "Asia/Taipei"
      match => [ "EventTime", "YYYY-MM-dd HH:mm:ss" ]
    }

  }
}

output {
  elasticsearch {
    hosts => ["localhost:9200"]
  }
}
Start it
nohup /usr/share/logstash/bin/logstash -f /etc/logstash/conf.d/sam.conf &Below is my conf in Nxlog and you can get Nxlog here
Add user to Kibana for secure access
htpasswd -c /etc/nginx/.htpasswds user
Add to nginx
auth_basic "Restricted";
auth_basic_user_file /etc/nginx/.htpasswd;
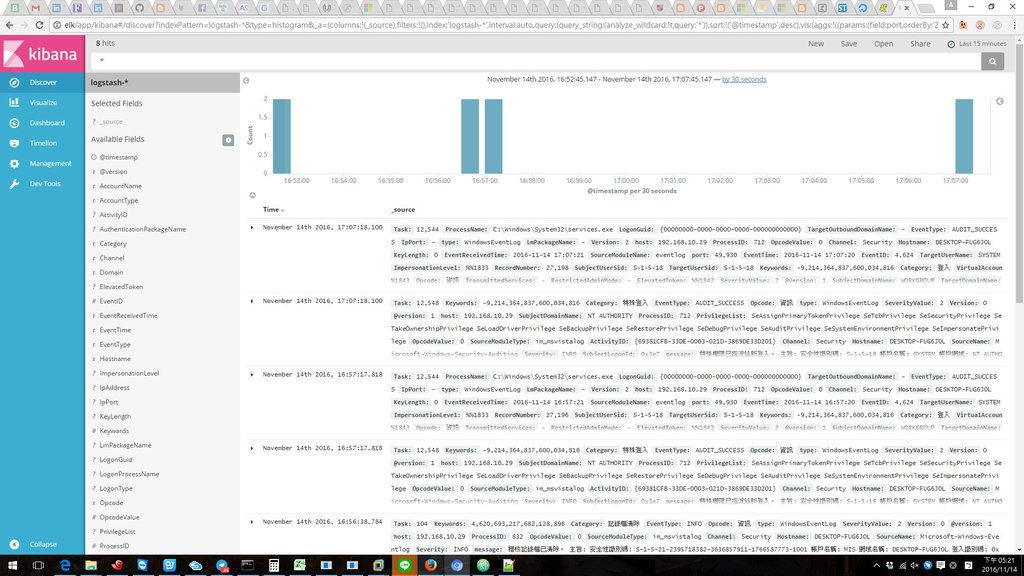
Here is results
And use this link to test Grok
########################################################################
Add Default dashboard to kibana when you login to display your custom dashboard
root@abcS:/etc/kibana# vi kibana.yml
###Modify###
default_app_id: "dashboard/sam"
############
and restart
root@abcS:/etc/kibana# systemctl restart kibana.service
